
![[Experimental]](figures/lifecycle-experimental.svg)
A method that creates a plot for DataCombo object.
Usage
# S4 method for class 'DataCombo,missing'
plot(x, y, legend = TRUE, ...)Value
A gtable object combining two ggplot2 plots.
Examples
data <- .DefaultDataCombo()

plot(data)
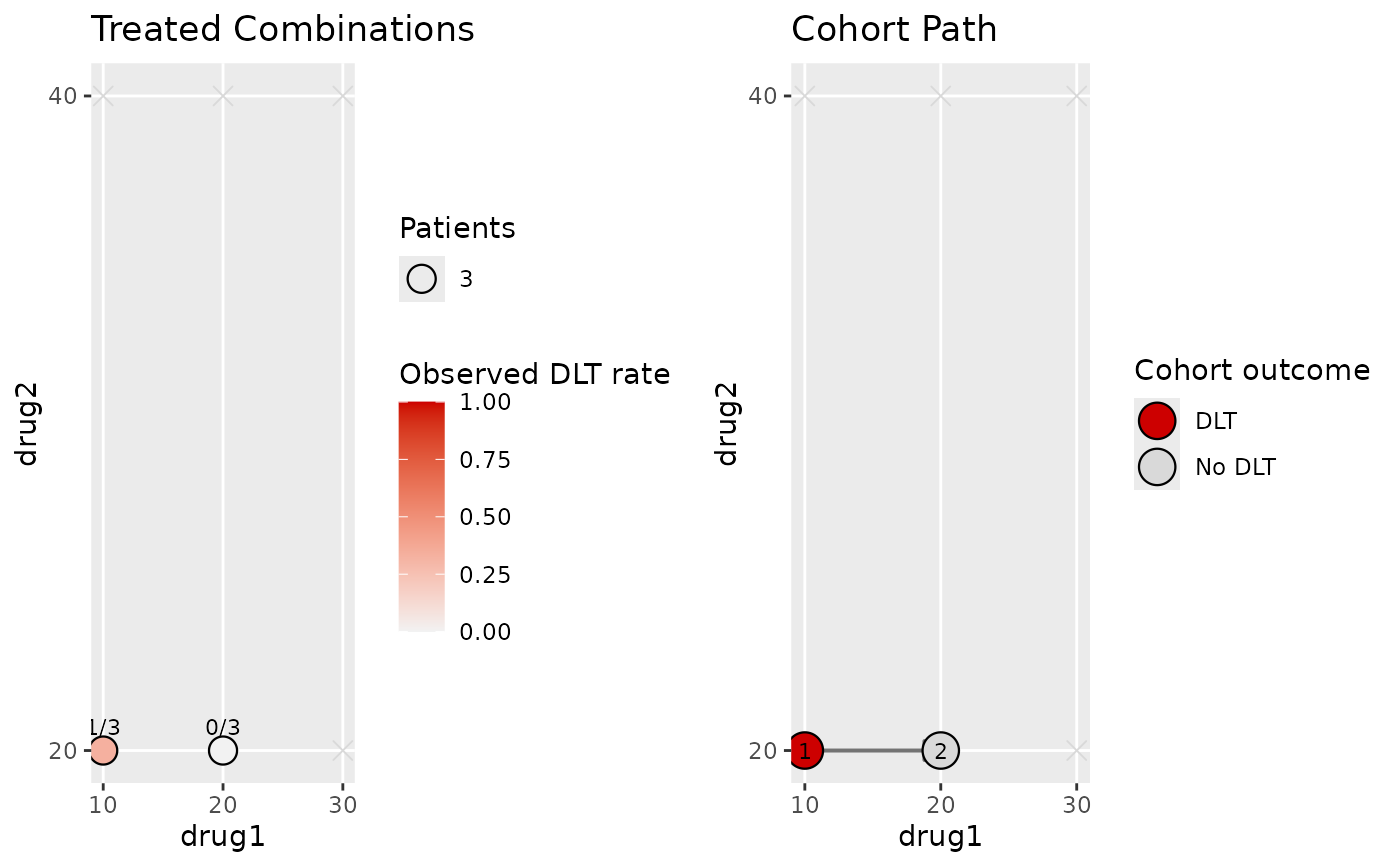
A method that creates a plot for DataCombo object.
# S4 method for class 'DataCombo,missing'
plot(x, y, legend = TRUE, ...)A gtable object combining two ggplot2 plots.
data <- .DefaultDataCombo()
plot(data)